Monitoring
Closely inspecting key data points, growing benchmarking datasets, annotating traces, and drilling down into important data in trace view are workflows you’ll also want to do once your app hits production. However, especially at the production stage, it’s crucial to get a high-level overview of application performance with respect to latency, cost, and feedback scores. This ensures that it's delivering desirable results at scale.
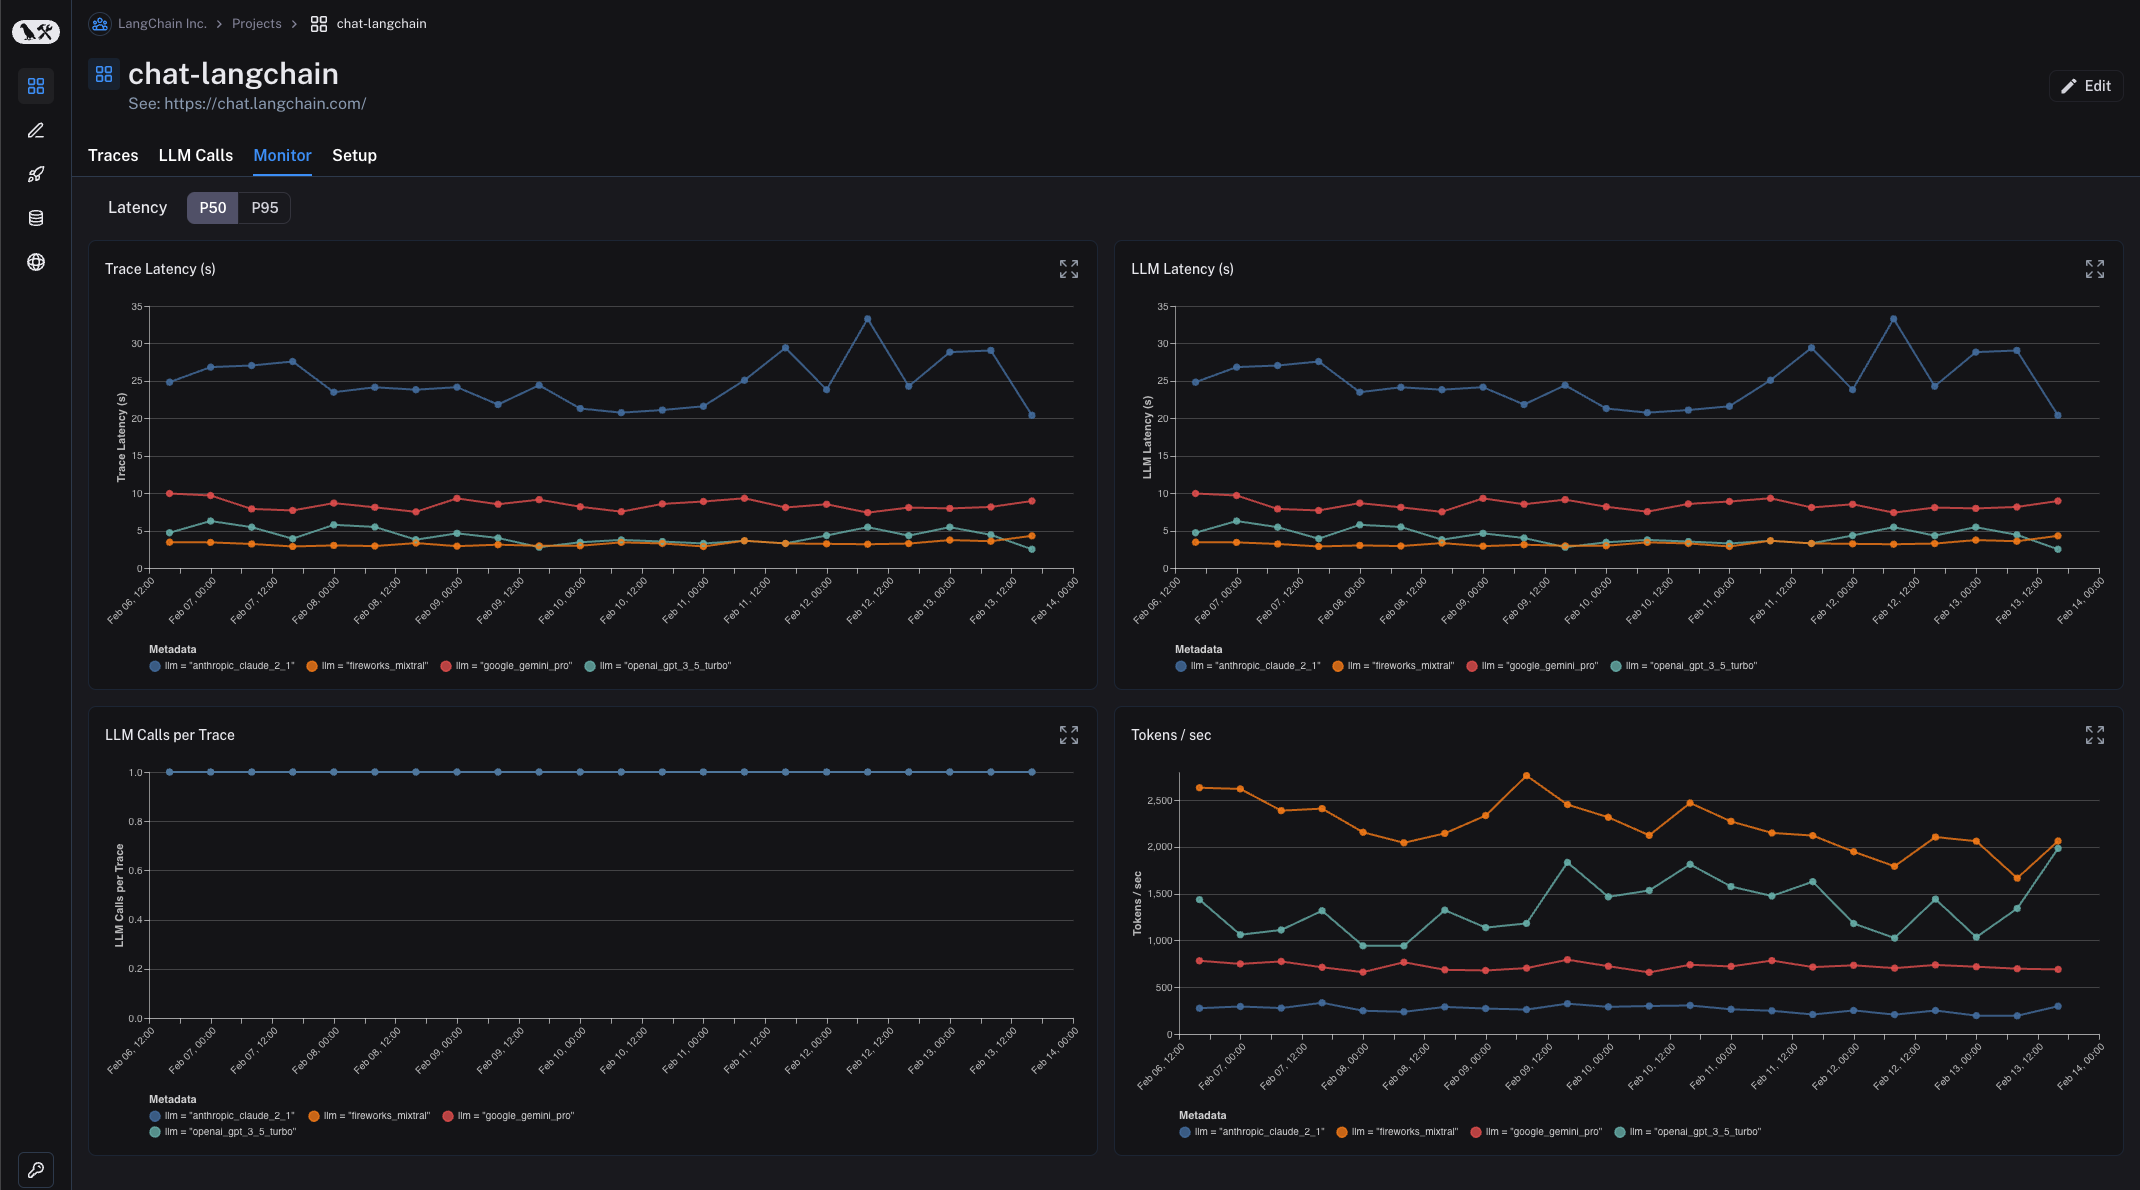
LangSmith provides monitoring charts that allow you to track key metrics over time. You can expand to view metrics for a given period and drill down into a specific data point to get a trace table for that time period — this is especially handy for debugging production issues.
To get started with monitoring, navigate to the Monitoring tab in the Project dashboard. Here, you can view charts such as Trace Latency, Tokens/Second, Cost, and feedback charts.
LangSmith also allows for tag and metadata grouping, which allows users to mark different versions of their applications with different identifiers and view how they are performing side-by-side within each chart. This is helpful for A/B testing changes in prompt, model, or retrieval strategy.